
R Sentiment Analysis
Analysis made in 2020 for the HEC cours: “Logiciels statistiques pour la gestion”, using R ggplot2. Sentiment analysis in R on the Donald Trump’s tweets.
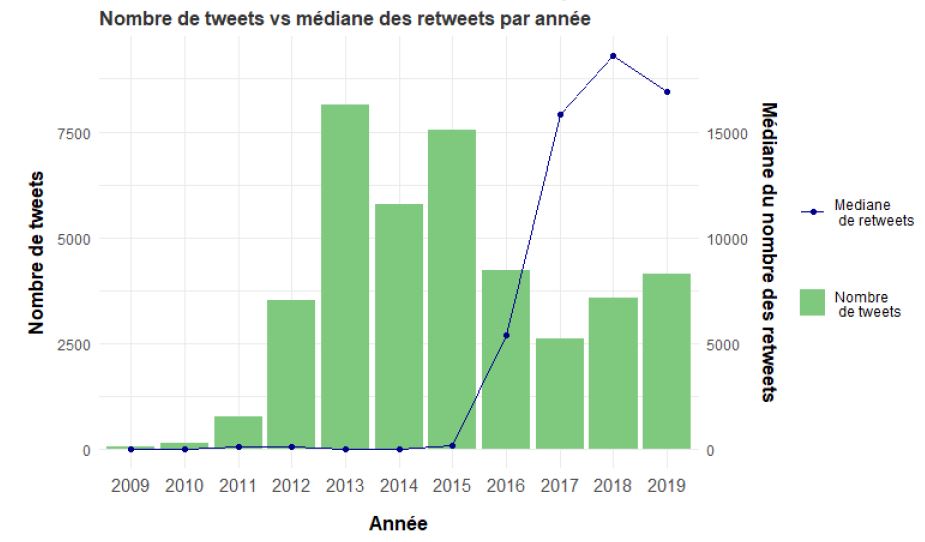
Number of tweets per year and median of retweets
Code:
    ggplot(lbc) +
    geom_bar(aes(x=factor(year), y=id_str, fill = "Nombre\n de tweets"), stat="identity") +
    geom_line(aes(x=factor(year), y=0.5*retweet_count, group = 1, color = "Mediane\n de retweets")) +
    scale_color_manual(NULL, values = "darkblue") +
    geom_point(aes(x = factor(year), y = 0.5*retweet_count, group = 1, color = "Mediane\n de retweets")) +
    scale_y_continuous(sec.axis = sec_axis(~./0.5, name = "Médiane du nombre des retweets")) +
    labs(title = "Nombre de tweets vs médiane des retweets par année",
       x = "Année",
       y = "Nombre de tweets",
       fill = " ") +
    scale_fill_brewer(palette="Accent")
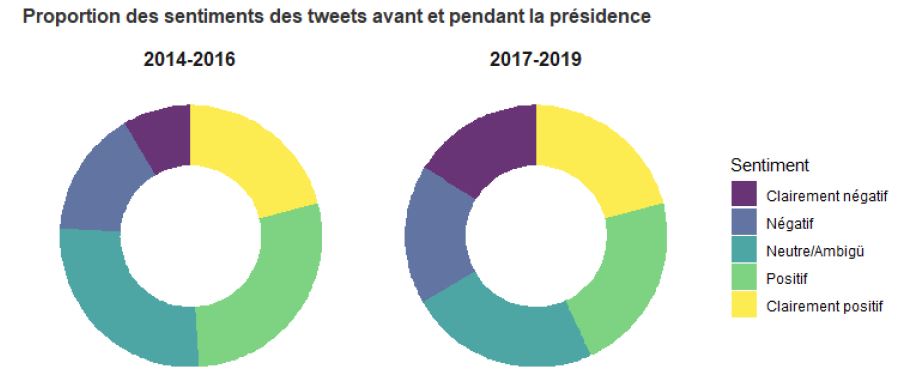
Proportion of negative and positive tweets before and during presidency
Code:
ggplot(df3ans, aes(x=2, y = id_str, fill=sentiment)) +
  geom_bar(stat = "identity", position = "fill", alpha = 0.8) +
  xlim(0.5, 2.5) +
  facet_grid(.~ periode) +
  coord_polar(theta = "y") +
  labs(title = "Proportion des sentiments des tweets avant et pendant la présidence",
       fill = "Sentiment")
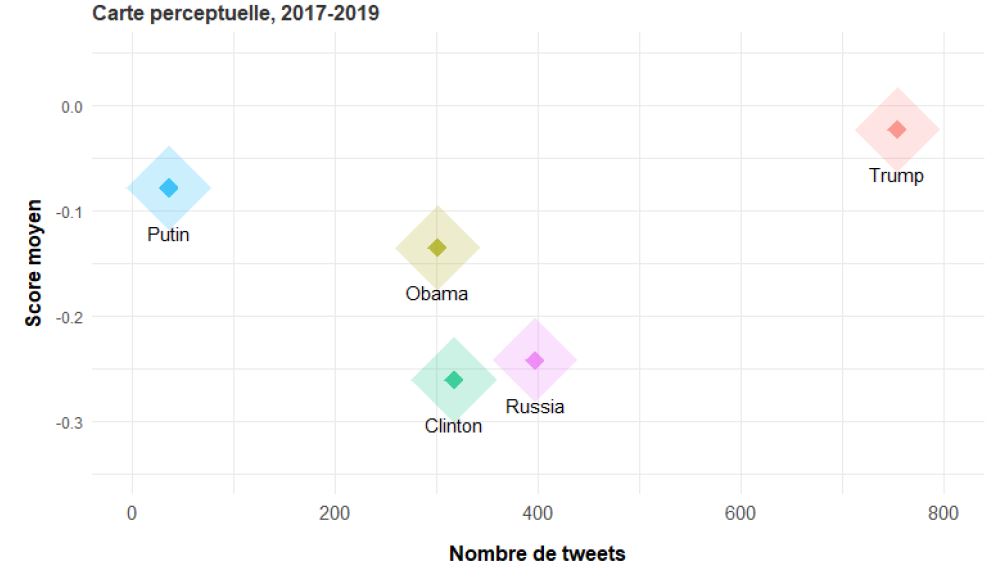
Perceptual map for 5 analysed entities
Code:
# Préparation des données
percept<- merge(aggregate(id_str ~ entites_q3, data = q3df[q3df$periode %in% c("2017-2019"),], FUN = "count.unique"),
                aggregate(score ~ entites_q3, data = q3df[q3df$periode %in% c("2017-2019"),], FUN = "mean"),
                by = "entites_q3")
percept

# Le graphique
ggplot(percept, aes(x=id_str, y=score)) +
  geom_point(aes(color = entites_q3), alpha = 0.7, shape = 18, size = 5) +
  annotate(geom = "text", x = percept$id_str, y = percept$score, label = percept$entites_q3, vjust = 3.4,
           xmin = 0, xmax = 800, ymin = -0.35, ymax = 0.05)+
  geom_point(aes(color = entites_q3), alpha = 0.2, shape = 18, size = 23) +
  labs(title = "Carte perceptuelle, 2017-2019",
       x = "Nombre de tweets",
       y = "Score moyen",
       color = "Entités") +
  theme_custom +
  theme_custom +
  theme(legend.position = "none")
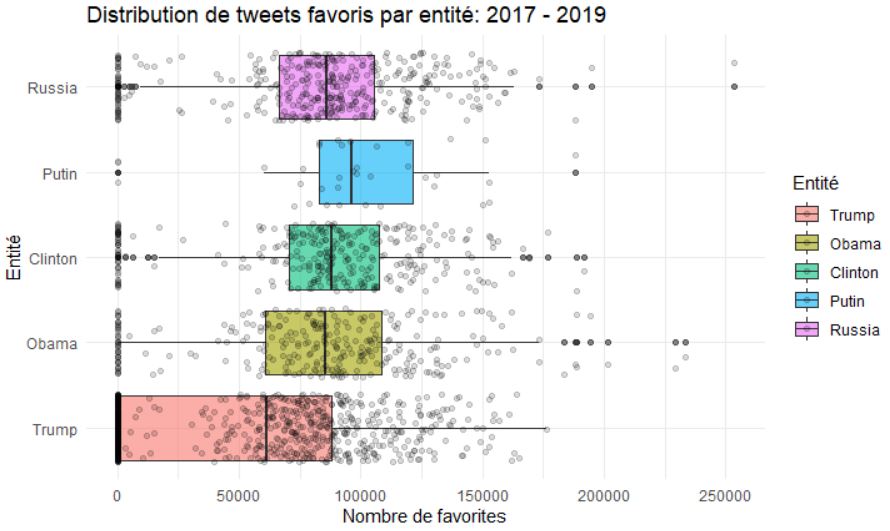
Distribution of favorite tweets
Code:
q3df2017_2019<- q3df[(q3df$year %in% c("2017", "2018", "2019")),]

ggplot(q3df2017_2019,
       aes(x=entites_q3, y=favorite_count, fill = entites_q3)) +
  geom_boxplot(alpha = 0.6) +
  geom_jitter(alpha = 0.15) +
  coord_flip() +
  labs(title = "Distribution de tweets favoris par entité: 2017 - 2019",
       x = "Entité",
       y = "Nombre de favorites",
       fill = "Entité")
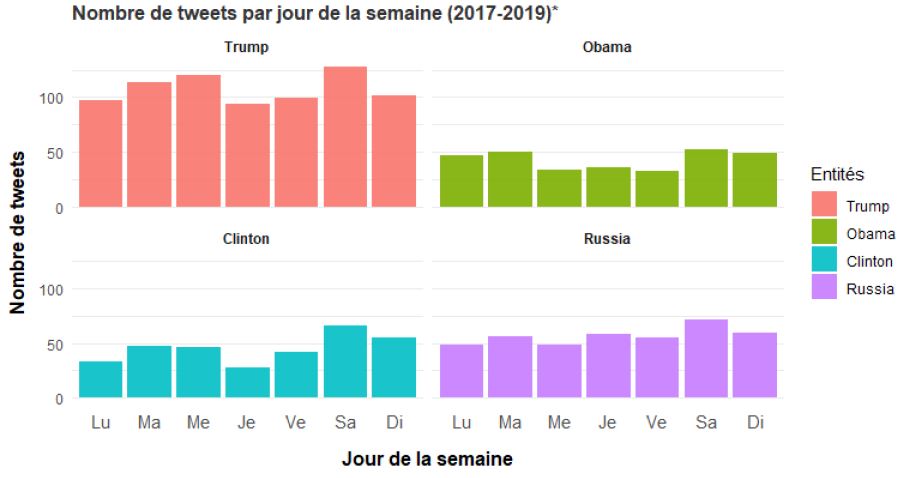
Number of tweets per weekday
Code:
# Préparation des données
jsem_2017_2019 <- aggregate(id_str ~ joursemaine + entites_q3 + sent3, data = q3df[q3df$periode %in% c("2017-2019"),],
                            FUN = length)

# Le graphique
ggplot(jsem_2017_2019[jsem_2017_2019$entites_q3 != "Putin",], aes(x=factor(joursemaine), y=id_str, fill = entites_q3)) +
  geom_bar(stat = "identity", alpha = 0.9) +
  facet_wrap(~ entites_q3) +
  labs(title = "Nombre de tweets par jour de la semaine (2017-2019)*,
       x = "Jour de la semaine",
       y = "Nombre de tweets",
       fill = "Entités")
Text analysis to select only 5 entities from all tweets
#####################
#####################
#EXTRACT Barack Obama

#Obama pattern. Criteria must be without spaces#
Obama<- grep(pattern = "Barack|Obama|barack|obama", x = tweets$entity_name, value = TRUE)
Obama

#To exclude. Associated with, but not Barack Obama.
not_BO <- grep(pattern = "Michelle", x = tweets$entity_name, value = TRUE)
not_BO

#Vector with rows that contain Barack Obama = 2477 rows
tweets_Obama_only<-tweets$entity_name[tweets$entity_name %in% Obama &
                                        !(tweets$entity_name %in% not_BO)]

########################
#EXTRACT Hillary Clinton

#Hillary pattern
Hillary<- grep(pattern = "Hillary|hillary|Clinton|clinton", x = tweets$entity_name, value = TRUE)
Hillary

#To exclude. Associated with, but not Hillary Clinton.
not_HC <- grep(pattern = "Bill|bill|Chelsea|chelsea", x = tweets$entity_name, value = TRUE)
not_HC

#Vector with rows that contain Hillary Clinton = 1211
tweets_Hillary_only<-tweets$entity_name[tweets$entity_name %in% Hillary &
                                          !(tweets$entity_name %in% not_HC)]

####################
#EXTRACT Vladimir Putin
Putin <- grep(pattern = "Vladimir|vladimir|Putin|putin", x = tweets$entity_name, value = TRUE)

#VIEW rows that contain Vladimir Putin = 101
tweets_Putin_only<-tweets$entity_name[tweets$entity_name %in% Putin]


####################
#EXTRCT Russia

Russia<- grep(pattern = "Russia", x = tweets$entity_name, value = TRUE)

#VIEW rows that contain Russia = 567
tweets_Russia_only<- tweets$entity_name[tweets$entity_name %in% Russia &
                                          !(tweets$entity_name %in% Putin)]

#####################
#EXTRACT Donald Trump

#Donald Trump pattern. ALL rows
Donald<- grep(pattern = "Donald|Trump|donald|trump", x = tweets$entity_name, value = TRUE)
Donald

#To exclude. Associated with, but not Donald Trump#
not_DT <- grep(pattern = "Melania|melania|ivanka|Ivanka|John|john|Eric|erictrump|fred|Fred|McDonald's|McDonalds|mcdonalds|mcdonald's", x = tweets$entity_name, value = TRUE)
not_DT

#VIEW rows that contain Donald Trump = 6594 rows
tweets_D_only<-tweets$entity_name[tweets$entity_name %in% Donald &
                                    !(tweets$entity_name %in% not_DT) &
                                    !(tweets$entity_name %in% Hillary) &
                                    !(tweets$entity_name %in% Obama) &
                                    !(tweets$entity_name %in% Putin) &
                                    !(tweets$entity_name %in% Russia)]

################
## NEW column in DB ##

tweets$Q3[tweets$entity_name %in% tweets_Russia_only] <- "Russia"
tweets$Q3[tweets$entity_name %in% tweets_Putin_only] <- "Vladimir Putin"
tweets$Q3[tweets$entity_name %in% tweets_Hillary_only] <- "Hillary Clinton"
tweets$Q3[tweets$entity_name %in% tweets_Obama_only] <- "Barack Obama"
tweets$Q3[tweets$entity_name %in% tweets_D_only] <- "Donald Trump"

###################
#NEW data frame. NA excluded from Q3 #

tweets_Q3<- tweets[!is.na(tweets$Q3),]

## AGGREGATE ###
aggregate(tweets_Q3$id_str ~ tweets_Q3$Q3, FUN = "length")

aggregate(tweets_Q3$id_str ~ tweets_Q3$Q3, FUN = "count.unique")


##################

tweets_Q3$period<- with(tweets_Q3, ifelse(year < 2017, "avant president", "president"))
presidentdf<- tweets_Q3[tweets_Q3$period == "president",]