Excel Data Analysis
Analyses made in 2019 - 2020 for HEC courses : “Introduction à l’analytique d’affaires”, “Modèles d’optimisation et de recherche opérationnelle”, “Systèmes d’information en gestion”.
Dashboard using conditional formatting and segments
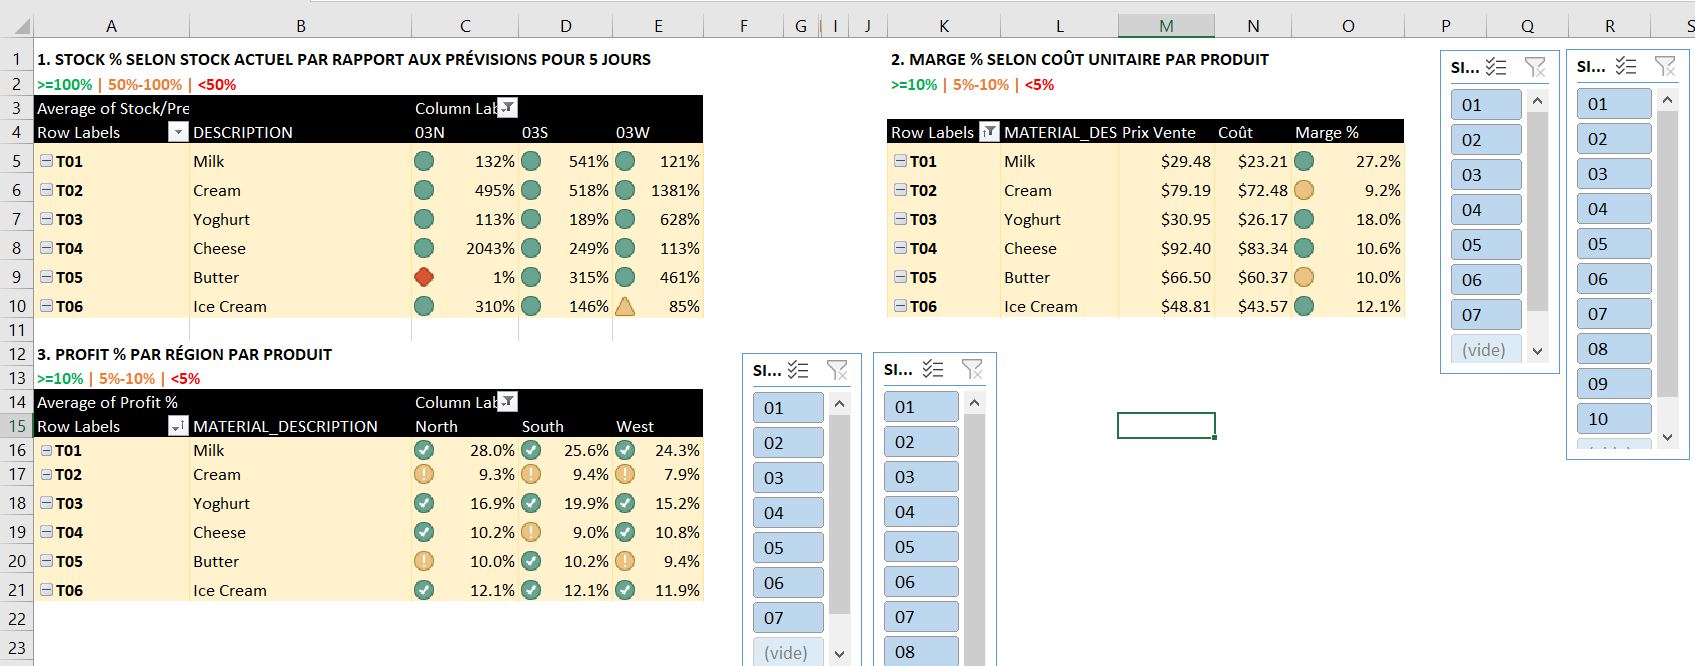 To see the image larger: right click on the photo -> open image in a new tab
Demand modelling
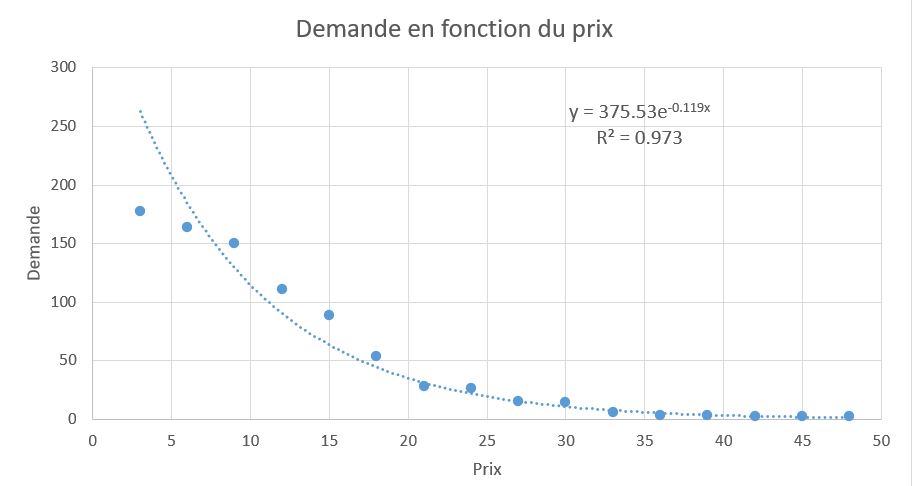
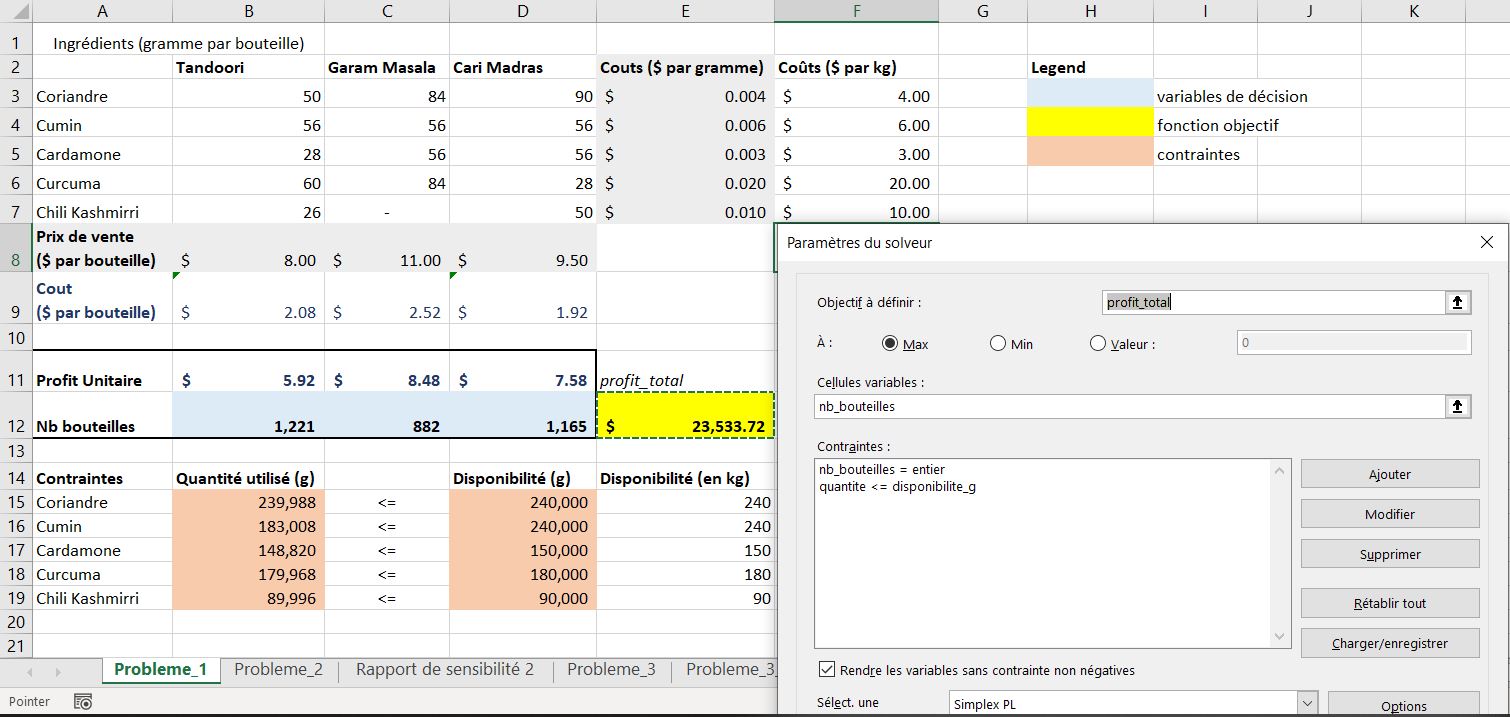
Optimization with hard constraints using Solver
 To see the image larger: right click on the photo -> open image in a new tab
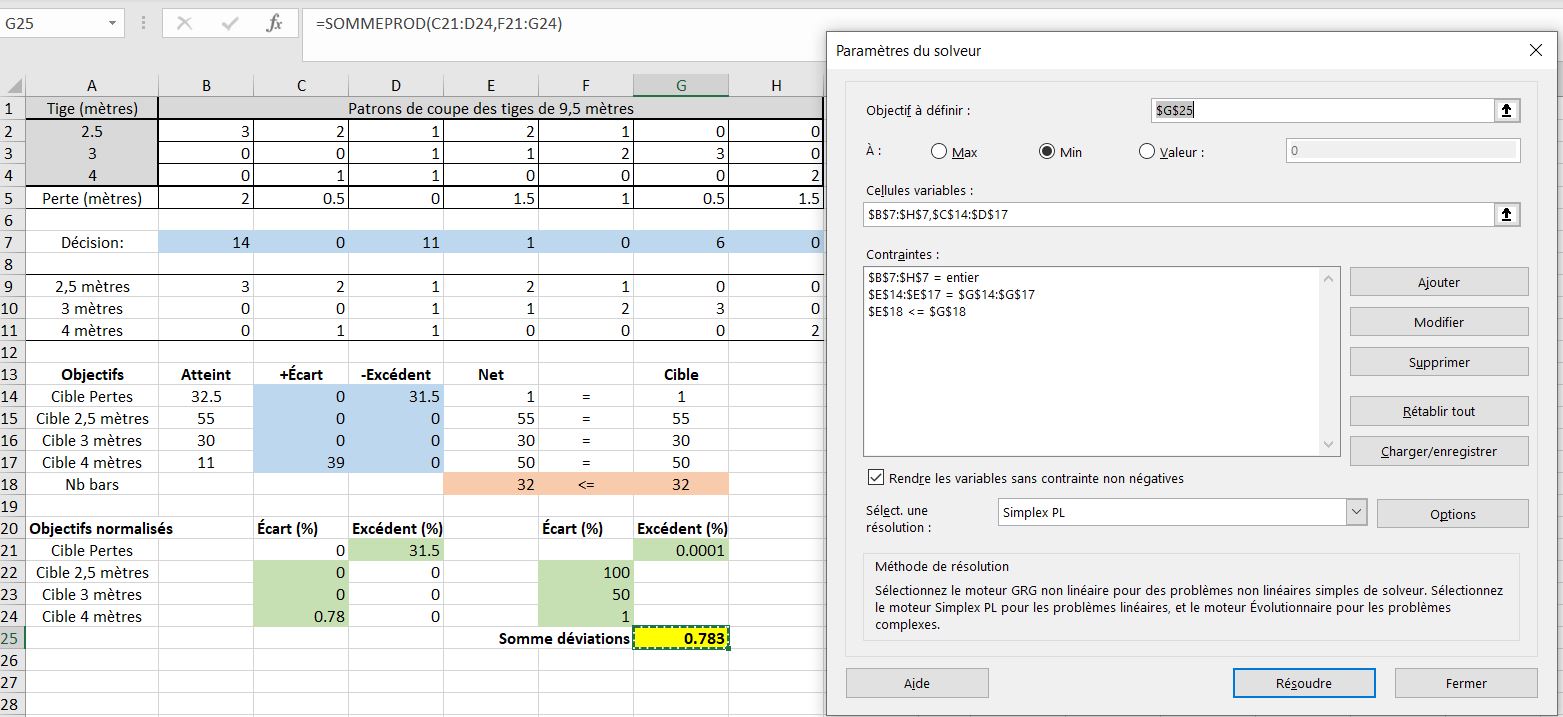
Optimization with soft constraints using Solver
 To see the image larger: right click on the photo -> open image in a new tab
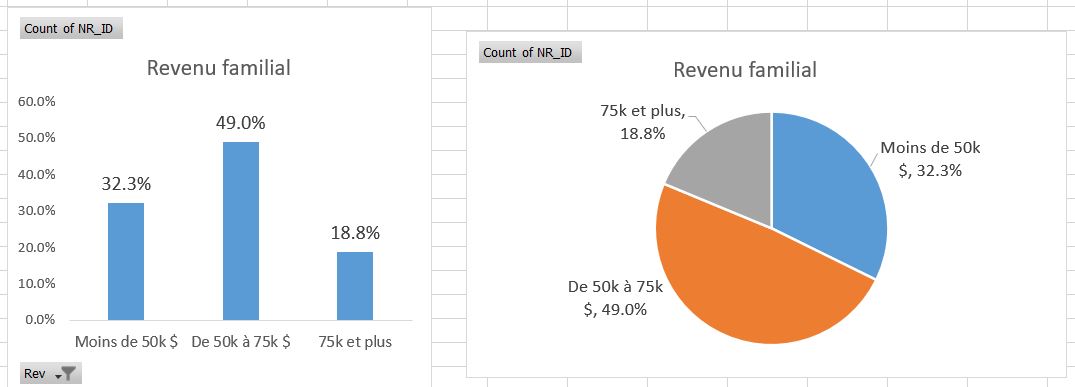
Charts showing revenue categories